Cointegration Buy and Sell Signals [EdgeTerminal]The Cointegration Buy And Sell Signals is a sophisticated technical analysis tool to spot high-probability market turning points — before they fully develop on price charts.
Most reversal indicators rely on raw price action, visual patterns, or basic and common indicator logic — which often suffer in noisy or trending markets. In most cases, they lag behind the actual change in trend and provide useless and late signals.
This indicator is rooted in advanced concepts from statistical arbitrage, mean reversion theory, and quantitative finance, and it packages these ideas in a user-friendly visual format that works on any timeframe and asset class.
It does this by analyzing how the short-term and long-term EMAs behave relative to each other — and uses statistical filters like Z-score, correlation, volatility normalization, and stationarity tests to issue highly selective Buy and Sell signals.
This tool provides statistical confirmation of trend exhaustion, allowing you to trade mean-reverting setups. It fades overextended moves and uses signal stacking to reduce false entries. The entire indicator is based on a very interesting mathematically grounded model which I will get into down below.
Here’s how the indicator works at a high level:
EMAs as Anchors: It starts with two Exponential Moving Averages (EMAs) — one short-term and one long-term — to track market direction.
Statistical Spread (Regression Residuals): It performs a rolling linear regression between the short and long EMA. Instead of using the raw difference (short - long), it calculates the regression residual, which better models their natural relationship.
Normalize the Spread: The spread is divided by historical price volatility (ATR) to make it scale-invariant. This ensures the indicator works on low-priced stocks, high-priced indices, and crypto alike.
Z-Score: It computes a Z-score of the normalized spread to measure how “extreme” the current deviation is from its historical average.
Dynamic Thresholds: Unlike most tools that use fixed thresholds (like Z = ±2), this one calculates dynamic thresholds using historical percentiles (e.g., top 10% and bottom 10%) so that it adapts to the asset's current behavior to reduce false signals based on market’s extreme volatility at a certain time.
Z-Score Momentum: It tracks the direction of the Z-score — if Z is extreme but still moving away from zero, it's too early. It waits for reversion to start (Z momentum flips).
Correlation Check: Uses a rolling Pearson correlation to confirm the two EMAs are still statistically related. If they diverge (low correlation), no signal is shown.
Stationarity Filter (ADF-like): Uses the volatility of the regression residual to determine if the spread is stationary (mean-reverting) — a key concept in cointegration and statistical arbitrage. It’s not possible to build an exact ADF filter in Pine Script so we used the next best thing.
Signal Control: Prevents noisy charts and overtrading by ensuring no back-to-back buy or sell signals. Each signal must alternate and respect a cooldown period so you won’t be overwhelmed and won’t get a messy chart.
Important Notes to Remember:
The whole idea behind this indicator is to try to use some stat arb models to detect shifting patterns faster than they appear on common indicators, so in some cases, some assumptions are made based on historic values.
This means that in some cases, the indicator can “jump” into the conclusion too quickly. Although we try to eliminate this by using stationary filters, correlation checks, and Z-score momentum detection, there is still a chance some signals that are generated can be too early, in the stock market, that's the same as being incorrect. So make sure to use this with other indicators to confirm the movement.
How To Use The Indicator:
You can use the indicator as a standalone reversal system, as a filter for overbought and oversold setups, in combination with other trend indicators and as a part of a signal stack with other common indicators for divergence spotting and fade trades.
The indicator produces simple buy and sell signals when all criteria is met. Based on our own testing, we recommend treating these signals as standalone and independent from each other . Meaning that if you take position after a buy signal, don’t wait for a sell signal to appear to exit the trade and vice versa.
This is why we recommend using this indicator with other advanced or even simple indicators as an early confirmation tool.
The Display Table:
The floating diagnostic table in the top-right corner of the chart is a key part of this indicator. It's a live statistical dashboard that helps you understand why a signal is (or isn’t) being triggered, and whether the market conditions are lining up for a potential reversal.
1. Z-Score
What it shows: The current Z-score value of the volatility-normalized spread between the short EMA and the regression line of the long EMA.
Why it matters: Z-score tells you how statistically extreme the current relationship is. A Z-score of:
0 = perfectly average
> +2 = very overbought
< -2 = very oversold
How to use it: Look for Z-score reaching extreme highs or lows (beyond dynamic thresholds). Watch for it to start reversing direction, especially when paired with green table rows (see below)
2. Z-Score Momentum
What it shows: The rate of change (ROC) of the Z-score:
Zmomentum=Zt − Zt − 1
Why it matters: This tells you if the Z-score is still stretching out (e.g., getting more overbought/oversold), or reverting back toward the mean.
How to use it: A positive Z-momentum after a very low Z-score = potential bullish reversal A negative Z-momentum after a very high Z-score = potential bearish reversal. Avoid signals when momentum is still pushing deeper into extremes
3. Correlation
What it shows: The rolling Pearson correlation coefficient between the short EMA and long EMA.
Why it matters: High correlation (closer to +1) means the EMAs are still statistically connected — a key requirement for cointegration or mean reversion to be valid.
How to use it: Look for correlation > 0.7 for reliable signals. If correlation drops below 0.5, ignore the Z-score — the EMAs aren’t moving together anymore
4. Stationary
What it shows: A simplified "Yes" or "No" answer to the question:
“Is the spread statistically stable (stationary) and mean-reverting right now?”
Why it matters: Mean reversion strategies only work when the spread is stationary — that is, when the distance between EMAs behaves like a rubber band, not a drifting cloud.
How to use it: A "Yes" means the indicator sees a consistent, stable spread — good for trading. "No" means the market is too volatile, disjointed, or chaotic for reliable mean reversion. Wait for this to flip to "Yes" before trusting signals
5. Last Signal
What it shows: The last signal issued by the system — either "Buy", "Sell", or "None"
Why it matters: Helps avoid confusion and repeated entries. Signals only alternate — you won’t get another Buy until a Sell happens, and vice versa.
How to use it: If the last signal was a "Buy", and you’re watching for a Sell, don’t act on more bullish signals. Great for systems where you only want one position open at a time
6. Bars Since Signal
What it shows: How many bars (candles) have passed since the last Buy or Sell signal.
Why it matters: Gives you context for how long the current condition has persisted
How to use it: If it says 1 or 2, a signal just happened — avoid jumping in late. If it’s been 10+ bars, a new opportunity might be brewing soon. You can use this to time exits if you want to fade a recent signal manually
Indicator Settings:
Short EMA: Sets the short-term EMA period. The smaller the number, the more reactive and more signals you get.
Long EMA: Sets the slow EMA period. The larger this number is, the smoother baseline, and more reliable trend bases are generated.
Z-Score Lookback: The period or bars used for mean & std deviation of spread between short and long EMAs. Larger values result in smoother signals with fewer false positives.
Volatility Window: This value normalizes the spread by historical volatility. This allows you to prevent scale distortion, showing you a cleaner and better chart.
Correlation Lookback: How many periods or how far back to test correlation between slow and long EMAs. This filters out false positives when EMAs lose alignment.
Hurst Lookback: The multiplier to approximate stationarity. Lower leads to more sensitivity to regime change, higher produces a more stricter filtering.
Z Threshold Percentile: This value sets how extreme Z-score must be to trigger a signal. For example, 90 equals only top/bottom 10% of extremes, 80 = more frequent.
Min Bars Between Signals: This hard stop prevents back-to-back signals. The idea is to avoid over-trading or whipsaws in volatile markets even when Hurst lookback and volatility window values are not enough to filter signals.
Some More Recommendations:
We recommend trying different EMA pairs (10/50, 21/100, 5/20) for different asset behaviors. You can set percentile to 85 or 80 if you want more frequent but looser signals. You can also use the Z-score reversion monitor for powerful confirmation.
Cari dalam skrip untuk "buy sell"

Order Flow Delta Trackerorderflow manager where you
Delta bars: Show net buying/selling per candle.
Cumulative Delta: Helps identify hidden buying/selling pressure.
If price rises but cumulative delta falls → possible hidden selling (divergence).
If price falls but cumulative delta rises → hidden buying.

Chandelier Exit with ZLSMA SwiftEdgeChandelier Exit with ZLSMA
Overview
The "Chandelier Exit with ZLSMA" indicator is a powerful trading tool designed to identify trend reversals and high-probability entry points in financial markets. By combining the volatility-based Chandelier Exit with the low-lag Zero Lag Least Squares Moving Average (ZLSMA), this indicator provides clear Buy and Sell signals, enhanced with a unique signal strength score to help traders prioritize high-quality opportunities. Visual enhancements, including dynamic color coding, background highlights, and trend arrows, make it intuitive and visually appealing for both novice and experienced traders.
What It Does
This indicator generates Buy and Sell signals when a trend reversal is detected by the Chandelier Exit, but only if the price crosses the ZLSMA for the first time in the direction of the trend. Each signal is accompanied by a percentage score (0-100%) that measures its strength based on price movement and momentum. The indicator overlays directly on the price chart, displaying:
Buy/Sell labels with signal strength (e.g., "Buy (85%)").
A ZLSMA line that changes color (green for bullish, red for bearish) to indicate trend direction.
Background highlights to mark signal candles.
Trend arrows to visually confirm signal points.
How It Works
The indicator combines two complementary components:
Chandelier Exit:
Uses the Average True Range (ATR) to create dynamic trailing stop levels (long_stop and short_stop) that adapt to market volatility.
Signals a Buy when the price crosses above the short stop (indicating a potential uptrend) and a Sell when it crosses below the long stop (indicating a potential downtrend).
Default settings use an ATR period of 1 and a multiplier of 2.0 for high sensitivity to short-term price movements.
Zero Lag LSMA (ZLSMA):
A low-lag moving average based on linear regression, designed to reduce delay compared to traditional moving averages.
Acts as a trend filter: Buy signals are only generated when the price closes above ZLSMA for the first time, and Sell signals when it closes below for the first time.
Default length of 50 balances smoothness with responsiveness.
Signal Strength Score:
Each signal is assigned a score (0-100%) based on:
Distance to ZLSMA (60% weight): How far the price is from ZLSMA, normalized by ATR. Larger distances indicate stronger breakouts.
Candlestick size (40% weight): The size of the signal candle, normalized by ATR. Larger candles suggest stronger momentum.
A high score (e.g., >80%) indicates a robust signal, while a low score (e.g., <50%) suggests caution.
Visual Features:
The ZLSMA line changes color (green for bullish, red for bearish) to reflect the trend.
Signal candles are highlighted with a subtle green (Buy) or red (Sell) background.
Tiny triangular arrows appear below Buy signals and above Sell signals for clear visual confirmation.
Why Combine Chandelier Exit and ZLSMA?
The Chandelier Exit excels at identifying trend reversals through volatility-based stops, but it can generate false signals in choppy markets due to its sensitivity (especially with a short ATR period of 1). The ZLSMA addresses this by acting as a trend filter, ensuring signals are only triggered when the price confirms a trend by crossing the ZLSMA for the first time. This combination reduces noise and focuses on high-probability setups. The signal strength score further enhances decision-making by quantifying the conviction behind each signal, making the indicator feel intuitive and "smart."
How to Use
Setup:
Add the indicator to your chart in TradingView.
Adjust inputs in the settings panel:
ATR Period (default: 1): Controls the sensitivity of Chandelier Exit. Increase for smoother signals.
ATR Multiplier (default: 2.0): Sets the distance of stop levels from price extremes.
ZLSMA Length (default: 50): Adjusts the smoothness of the ZLSMA line. Shorter lengths (e.g., 20-30) are more responsive; longer lengths (e.g., 50-100) are smoother.
Use Close Price for Extremums (default: true): Determines whether Chandelier Exit uses closing prices or high/low prices for calculations.
Interpreting Signals:
Buy Signal: A green "Buy (X%)" label appears below a candle when the price crosses above the Chandelier Exit short stop and closes above ZLSMA for the first time. The percentage indicates signal strength (higher = stronger).
Sell Signal: A red "Sell (X%)" label appears above a candle when the price crosses below the Chandelier Exit long stop and closes below ZLSMA for the first time.
Use the ZLSMA line’s color (green for bullish, red for bearish) to confirm the overall trend.
Prioritize signals with high strength scores (e.g., >70%) for better reliability.
Trading Considerations:
Combine signals with other analysis (e.g., support/resistance, volume) for confirmation.
Test the indicator on a demo account or use TradingView’s Strategy Tester to evaluate performance.
Be cautious with the default ATR period of 1, as it is highly sensitive and may generate frequent signals in volatile markets.
What Makes It Unique
This indicator stands out due to its thoughtful integration of Chandelier Exit and ZLSMA, creating a synergy that balances sensitivity with reliability. The first-cross filter ensures signals are triggered only at the start of potential trends, reducing false positives. The signal strength score adds a layer of intelligence, helping traders assess the quality of each signal without needing external tools. Visual enhancements, such as dynamic ZLSMA coloring, background highlights, and trend arrows, make the indicator user-friendly and visually engaging, appealing to traders seeking a modern, intuitive tool.
Limitations and Notes
The short ATR period (1) makes the indicator highly sensitive, which suits short-term traders but may produce noise in sideways markets. Increase the ATR period for smoother signals.
The signal strength score is a heuristic based on price movement and momentum, not a predictive model. Use it as a guide, not a definitive predictor.
Always backtest the indicator on your preferred market and timeframe to ensure it aligns with your trading strategy.

RSI Forecast [Titans_Invest]RSI Forecast
Introducing one of the most impressive RSI indicators ever created – arguably the best on TradingView, and potentially the best in the world.
RSI Forecast is a visionary evolution of the classic RSI, merging powerful customization with groundbreaking predictive capabilities. While preserving the core principles of traditional RSI, it takes analysis to the next level by allowing users to anticipate potential future RSI movements.
Real-Time RSI Forecasting:
For the first time ever, an RSI indicator integrates linear regression using the least squares method to accurately forecast the future behavior of the RSI. This innovation empowers traders to stay one step ahead of the market with forward-looking insight.
Highly Customizable:
Easily adapt the indicator to your personal trading style. Fine-tune a variety of parameters to generate signals perfectly aligned with your strategy.
Innovative, Unique, and Powerful:
This is the world’s first RSI Forecast to apply this predictive approach using least squares linear regression. A truly elite-level tool designed for traders who want a real edge in the market.
⯁ SCIENTIFIC BASIS LINEAR REGRESSION
Linear Regression is a fundamental method of statistics and machine learning, used to model the relationship between a dependent variable y and one or more independent variables 𝑥.
The general formula for a simple linear regression is given by:
y = β₀ + β₁x + ε
Where:
y = is the predicted variable (e.g. future value of RSI)
x = is the explanatory variable (e.g. time or bar index)
β0 = is the intercept (value of 𝑦 when 𝑥 = 0)
𝛽1 = is the slope of the line (rate of change)
ε = is the random error term
The goal is to estimate the coefficients 𝛽0 and 𝛽1 so as to minimize the sum of the squared errors — the so-called Random Error Method Least Squares.
⯁ LEAST SQUARES ESTIMATION
To minimize the error between predicted and observed values, we use the following formulas:
β₁ = /
β₀ = ȳ - β₁x̄
Where:
∑ = sum
x̄ = mean of x
ȳ = mean of y
x_i, y_i = individual values of the variables.
Where:
x_i and y_i are the means of the independent and dependent variables, respectively.
i ranges from 1 to n, the number of observations.
These equations guarantee the best linear unbiased estimator, according to the Gauss-Markov theorem, assuming homoscedasticity and linearity.
⯁ LINEAR REGRESSION IN MACHINE LEARNING
Linear regression is one of the cornerstones of supervised learning. Its simplicity and ability to generate accurate quantitative predictions make it essential in AI systems, predictive algorithms, time series analysis, and automated trading strategies.
By applying this model to the RSI, you are literally putting artificial intelligence at the heart of a classic indicator, bringing a new dimension to technical analysis.
⯁ VISUAL INTERPRETATION
Imagine an RSI time series like this:
Time →
RSI →
The regression line will smooth these values and extend them n periods into the future, creating a predicted trajectory based on the historical moment. This line becomes the predicted RSI, which can be crossed with the actual RSI to generate more intelligent signals.
⯁ SUMMARY OF SCIENTIFIC CONCEPTS USED
Linear Regression Models the relationship between variables using a straight line.
Least Squares Minimizes the sum of squared errors between prediction and reality.
Time Series Forecasting Estimates future values based on historical data.
Supervised Learning Trains models to predict outputs from known inputs.
Statistical Smoothing Reduces noise and reveals underlying trends.
⯁ WHY THIS INDICATOR IS REVOLUTIONARY
Scientifically-based: Based on statistical theory and mathematical inference.
Unprecedented: First public RSI with least squares predictive modeling.
Intelligent: Built with machine learning logic.
Practical: Generates forward-thinking signals.
Customizable: Flexible for any trading strategy.
⯁ CONCLUSION
By combining RSI with linear regression, this indicator allows a trader to predict market momentum, not just follow it.
RSI Forecast is not just an indicator — it is a scientific breakthrough in technical analysis technology.
⯁ Example of simple linear regression, which has one independent variable:
⯁ In linear regression, observations ( red ) are considered to be the result of random deviations ( green ) from an underlying relationship ( blue ) between a dependent variable ( y ) and an independent variable ( x ).
⯁ Visualizing heteroscedasticity in a scatterplot against 100 random fitted values using Matlab:
⯁ The data sets in the Anscombe's quartet are designed to have approximately the same linear regression line (as well as nearly identical means, standard deviations, and correlations) but are graphically very different. This illustrates the pitfalls of relying solely on a fitted model to understand the relationship between variables.
⯁ The result of fitting a set of data points with a quadratic function:
_______________________________________________________________________
🥇 This is the world’s first RSI indicator with: Linear Regression for Forecasting 🥇_______________________________________________________________________
_________________________________________________
🔮 Linear Regression: PineScript Technical Parameters 🔮
_________________________________________________
Forecast Types:
• Flat: Assumes prices will remain the same.
• Linreg: Makes a 'Linear Regression' forecast for n periods.
Technical Information:
ta.linreg (built-in function)
Linear regression curve. A line that best fits the specified prices over a user-defined time period. It is calculated using the least squares method. The result of this function is calculated using the formula: linreg = intercept + slope * (length - 1 - offset), where intercept and slope are the values calculated using the least squares method on the source series.
Syntax:
• Function: ta.linreg()
Parameters:
• source: Source price series.
• length: Number of bars (period).
• offset: Offset.
• return: Linear regression curve.
This function has been cleverly applied to the RSI, making it capable of projecting future values based on past statistical trends.
______________________________________________________
______________________________________________________
⯁ WHAT IS THE RSI❓
The Relative Strength Index (RSI) is a technical analysis indicator developed by J. Welles Wilder. It measures the magnitude of recent price movements to evaluate overbought or oversold conditions in a market. The RSI is an oscillator that ranges from 0 to 100 and is commonly used to identify potential reversal points, as well as the strength of a trend.
⯁ HOW TO USE THE RSI❓
The RSI is calculated based on average gains and losses over a specified period (usually 14 periods). It is plotted on a scale from 0 to 100 and includes three main zones:
• Overbought: When the RSI is above 70, indicating that the asset may be overbought.
• Oversold: When the RSI is below 30, indicating that the asset may be oversold.
• Neutral Zone: Between 30 and 70, where there is no clear signal of overbought or oversold conditions.
______________________________________________________
______________________________________________________
⯁ ENTRY CONDITIONS
The conditions below are fully flexible and allow for complete customization of the signal.
______________________________________________________
______________________________________________________
🔹 CONDITIONS TO BUY 📈
______________________________________________________
• Signal Validity: The signal will remain valid for X bars .
• Signal Sequence: Configurable as AND or OR .
📈 RSI Conditions:
🔹 RSI > Upper
🔹 RSI < Upper
🔹 RSI > Lower
🔹 RSI < Lower
🔹 RSI > Middle
🔹 RSI < Middle
🔹 RSI > MA
🔹 RSI < MA
📈 MA Conditions:
🔹 MA > Upper
🔹 MA < Upper
🔹 MA > Lower
🔹 MA < Lower
📈 Crossovers:
🔹 RSI (Crossover) Upper
🔹 RSI (Crossunder) Upper
🔹 RSI (Crossover) Lower
🔹 RSI (Crossunder) Lower
🔹 RSI (Crossover) Middle
🔹 RSI (Crossunder) Middle
🔹 RSI (Crossover) MA
🔹 RSI (Crossunder) MA
🔹 MA (Crossover) Upper
🔹 MA (Crossunder) Upper
🔹 MA (Crossover) Lower
🔹 MA (Crossunder) Lower
📈 RSI Divergences:
🔹 RSI Divergence Bull
🔹 RSI Divergence Bear
📈 RSI Forecast:
🔮 RSI (Crossover) MA Forecast
🔮 RSI (Crossunder) MA Forecast
______________________________________________________
______________________________________________________
🔸 CONDITIONS TO SELL 📉
______________________________________________________
• Signal Validity: The signal will remain valid for X bars .
• Signal Sequence: Configurable as AND or OR .
📉 RSI Conditions:
🔸 RSI > Upper
🔸 RSI < Upper
🔸 RSI > Lower
🔸 RSI < Lower
🔸 RSI > Middle
🔸 RSI < Middle
🔸 RSI > MA
🔸 RSI < MA
📉 MA Conditions:
🔸 MA > Upper
🔸 MA < Upper
🔸 MA > Lower
🔸 MA < Lower
📉 Crossovers:
🔸 RSI (Crossover) Upper
🔸 RSI (Crossunder) Upper
🔸 RSI (Crossover) Lower
🔸 RSI (Crossunder) Lower
🔸 RSI (Crossover) Middle
🔸 RSI (Crossunder) Middle
🔸 RSI (Crossover) MA
🔸 RSI (Crossunder) MA
🔸 MA (Crossover) Upper
🔸 MA (Crossunder) Upper
🔸 MA (Crossover) Lower
🔸 MA (Crossunder) Lower
📉 RSI Divergences:
🔸 RSI Divergence Bull
🔸 RSI Divergence Bear
📉 RSI Forecast:
🔮 RSI (Crossover) MA Forecast
🔮 RSI (Crossunder) MA Forecast
______________________________________________________
______________________________________________________
🤖 AUTOMATION 🤖
• You can automate the BUY and SELL signals of this indicator.
______________________________________________________
______________________________________________________
⯁ UNIQUE FEATURES
______________________________________________________
Linear Regression: (Forecast)
Signal Validity: The signal will remain valid for X bars
Signal Sequence: Configurable as AND/OR
Condition Table: BUY/SELL
Condition Labels: BUY/SELL
Plot Labels in the Graph Above: BUY/SELL
Automate and Monitor Signals/Alerts: BUY/SELL
Linear Regression (Forecast)
Signal Validity: The signal will remain valid for X bars
Signal Sequence: Configurable as AND/OR
Condition Table: BUY/SELL
Condition Labels: BUY/SELL
Plot Labels in the Graph Above: BUY/SELL
Automate and Monitor Signals/Alerts: BUY/SELL
______________________________________________________
📜 SCRIPT : RSI Forecast
🎴 Art by : @Titans_Invest & @DiFlip
👨💻 Dev by : @Titans_Invest & @DiFlip
🎑 Titans Invest — The Wizards Without Gloves 🧤
✨ Enjoy!
______________________________________________________
o Mission 🗺
• Inspire Traders to manifest Magic in the Market.
o Vision 𐓏
• To elevate collective Energy 𐓷𐓏

RSI Full [Titans_Invest]RSI Full
One of the most complete RSI indicators on the market.
While maintaining the classic RSI foundation, our indicator integrates multiple entry conditions to generate more accurate buy and sell signals.
All conditions are fully configurable, allowing complete customization to fit your trading strategy.
⯁ WHAT IS THE RSI❓
The Relative Strength Index (RSI) is a technical analysis indicator developed by J. Welles Wilder. It measures the magnitude of recent price movements to evaluate overbought or oversold conditions in a market. The RSI is an oscillator that ranges from 0 to 100 and is commonly used to identify potential reversal points, as well as the strength of a trend.
⯁ HOW TO USE THE RSI❓
The RSI is calculated based on average gains and losses over a specified period (usually 14 periods). It is plotted on a scale from 0 to 100 and includes three main zones:
Overbought: When the RSI is above 70, indicating that the asset may be overbought.
Oversold: When the RSI is below 30, indicating that the asset may be oversold.
Neutral Zone: Between 30 and 70, where there is no clear signal of overbought or oversold conditions.
⯁ ENTRY CONDITIONS
The conditions below are fully flexible and allow for complete customization of the signal.
______________________________________________________
🔹 CONDITIONS TO BUY 📈
______________________________________________________
• Signal Validity: The signal will remain valid for X bars .
• Signal Sequence: Configurable as AND/OR .
📈 RSI Conditions:
🔹 RSI > Upper
🔹 RSI < Upper
🔹 RSI > Lower
🔹 RSI < Lower
🔹 RSI > Middle
🔹 RSI < Middle
🔹 RSI > MA
🔹 RSI < MA
📈 MA Conditions:
🔹 MA > Upper
🔹 MA < Upper
🔹 MA > Lower
🔹 MA < Lower
📈 Crossovers:
🔹 RSI (Crossover) Upper
🔹 RSI (Crossunder) Upper
🔹 RSI (Crossover) Lower
🔹 RSI (Crossunder) Lower
🔹 RSI (Crossover) Middle
🔹 RSI (Crossunder) Middle
🔹 RSI (Crossover) MA
🔹 RSI (Crossunder) MA
🔹 MA (Crossover) Upper
🔹 MA (Crossunder) Upper
🔹 MA (Crossover) Lower
🔹 MA (Crossunder) Lower
📈 RSI Divergences:
🔹 RSI Divergence Bull
🔹 RSI Divergence Bear
______________________________________________________
______________________________________________________
🔸 CONDITIONS TO SELL 📉
______________________________________________________
• Signal Validity: The signal will remain valid for X bars .
• Signal Sequence: Configurable as AND/OR .
📉 RSI Conditions:
🔸 RSI > Upper
🔸 RSI < Upper
🔸 RSI > Lower
🔸 RSI < Lower
🔸 RSI > Middle
🔸 RSI < Middle
🔸 RSI > MA
🔸 RSI < MA
📉 MA Conditions:
🔸 MA > Upper
🔸 MA < Upper
🔸 MA > Lower
🔸 MA < Lower
📉 Crossovers:
🔸 RSI (Crossover) Upper
🔸 RSI (Crossunder) Upper
🔸 RSI (Crossover) Lower
🔸 RSI (Crossunder) Lower
🔸 RSI (Crossover) Middle
🔸 RSI (Crossunder) Middle
🔸 RSI (Crossover) MA
🔸 RSI (Crossunder) MA
🔸 MA (Crossover) Upper
🔸 MA (Crossunder) Upper
🔸 MA (Crossover) Lower
🔸 MA (Crossunder) Lower
📉 RSI Divergences:
🔸 RSI Divergence Bull
🔸 RSI Divergence Bear
______________________________________________________
______________________________________________________
🤖 AUTOMATION 🤖
• You can automate the BUY and SELL signals of this indicator.
______________________________________________________
______________________________________________________
⯁ UNIQUE FEATURES
______________________________________________________
Signal Validity: The signal will remain valid for X bars
Signal Sequence: Configurable as AND/OR
Condition Table: BUY/SELL
Condition Labels: BUY/SELL
Plot Labels in the Graph Above: BUY/SELL
Automate and Monitor Signals/Alerts: BUY/SELL
Signal Validity: The signal will remain valid for X bars
Signal Sequence: Configurable as AND/OR
Condition Table: BUY/SELL
Condition Labels: BUY/SELL
Plot Labels in the Graph Above: BUY/SELL
Automate and Monitor Signals/Alerts: BUY/SELL
______________________________________________________
📜 SCRIPT : RSI Full
🎴 Art by : @Titans_Invest & @DiFlip
👨💻 Dev by : @Titans_Invest & @DiFlip
🎑 Titans Invest — The Wizards Without Gloves 🧤
✨ Enjoy the Spell!
______________________________________________________
o Mission 🗺
• Inspire Traders to manifest Magic in the Market.
o Vision 𐓏
• To elevate collective Energy 𐓷𐓏

Body Percentage of Range (Colored)Short Description:
This indicator measures the dominance of the candle's body relative to its total range (High - Low), providing a visual gauge of intra-candle strength versus indecision. Columns are colored based on whether the body constitutes more or less than a defined percentage (default 50%) of the candle's total height.
Detailed Description:
What it Does:
The "Body Percentage of Range" indicator calculates, for each candle, what percentage of the total price range (High minus Low) is occupied by the candle's body (absolute difference between Open and Close).
A value of 100% means the candle has no wicks (a Marubozu), indicating strong conviction during that period.
A value of 0% means the candle has no body (a Doji), indicating perfect indecision.
Values in between show the relative balance between the directional move (body) and the price exploration/rejection (wicks).
How to Interpret:
The indicator plots this percentage as columns:
Column Height: Represents the percentage of the body relative to the total range. Higher columns indicate a larger body dominance.
Column Color:
Green Columns: Appear when the body percentage is above the user-defined threshold (default 50%). This suggests that the directional move within the candle was stronger than the indecision (wicks). Often seen during trending moves or strong momentum candles.
Red Columns: Appear when the body percentage is at or below the user-defined threshold (default 50%). This suggests that wicks dominate the candle (body is 50% or less of the range), indicating significant indecision, struggle between buyers and sellers, or potential reversals. These are common in choppy, consolidating, or reversal market conditions.
Orange Line (Optional MA): A Simple Moving Average (SMA) of the body percentages is plotted to help smooth the readings and identify broader periods where candle structure indicates more trending (high MA) vs. ranging/indecisive (low MA) characteristics.
Potential Use Cases:
Identifying Choppy vs. Trending Markets: Sustained periods of low, predominantly red columns (and often a low/declining MA) can signal a choppy, range-bound market where trend-following strategies might underperform. Conversely, periods with frequent high, green columns suggest a more trending environment.
Confirming Breakouts/Momentum: High green columns appearing alongside increased volume during a breakout can add conviction to the move's strength.
Spotting Potential Exhaustion/Reversals: A very tall green column after a strong trend, followed immediately by a low red column (like a Doji or Spinning Top pattern appearing on the price chart), might signal potential exhaustion or a pending reversal, indicating indecision has suddenly entered the market.
Filtering Entries: Traders might avoid taking entries (especially trend-following ones) when the indicator shows a consistent pattern of low red columns, suggesting high market indecision.
Settings:
Color Threshold %: Allows you to set the percentage level above which columns turn green (default is 50%).
Smoothing MA Length: Adjusts the lookback period for the Simple Moving Average.
Disclaimer:
This indicator is a tool for technical analysis and should be used in conjunction with other methods (like price action, volume analysis, other indicators) and robust risk management. It does not provide direct buy/sell signals and past performance is not indicative of future results.

Customizable RSI/StochRSI Double ConfirmationBelow are the key adjustable parameters in the script and their usage:
RSI Parameters
RSI Length: The number of periods used to calculate the RSI, with a default value of 7. Adjusting this parameter changes the sensitivity of the RSI—shorter periods make it more sensitive, while longer periods make it smoother.
RSI Source: The price source used for RSI calculation, defaulting to the closing price (close). This can be changed to the opening price or other price types as needed.
StochRSI Parameters
StochRSI Length: The number of periods used to calculate the StochRSI, with a default value of 5. This affects how quickly the StochRSI reacts to changes in the RSI.
StochRSI Smooth K: The smoothing period for the StochRSI %K line, with a default value of 3. This is used to reduce noise.
StochRSI Smooth D: The smoothing period for the StochRSI %D line, with a default value of 3. It works in conjunction with %K to provide more stable signals.
Signal Thresholds
RSI Buy Threshold: A buy signal is triggered when the RSI crosses above this value (default 20).
RSI Sell Threshold: A sell signal is triggered when the RSI crosses below this value (default 80).
StochRSI Buy Threshold: A buy signal is triggered when the StochRSI %K crosses above this value (default 20).
StochRSI Sell Threshold: A sell signal is triggered when the StochRSI %K crosses below this value (default 80).
Signals
RSI Buy/Sell Signals: When the RSI crosses the buy/sell threshold, a green "RSI Buy" or red "RSI Sell" is displayed on the chart.
StochRSI Buy/Sell Signals: When the StochRSI %K crosses the buy/sell threshold, a yellow "StochRSI Buy" or purple "StochRSI Sell" is displayed.
Double Buy/Sell Signals: When both RSI and StochRSI simultaneously trigger buy/sell signals, a green "Double Buy" or red "Double Sell" is displayed, indicating a stronger trading opportunity.
The volatility of different cryptocurrencies varies, and different parameters may be suitable for each. Users need to experiment and select the most appropriate parameters themselves.
Disclaimer: This script is for informational purposes only and should not be considered financial advice; use it at your own risk.

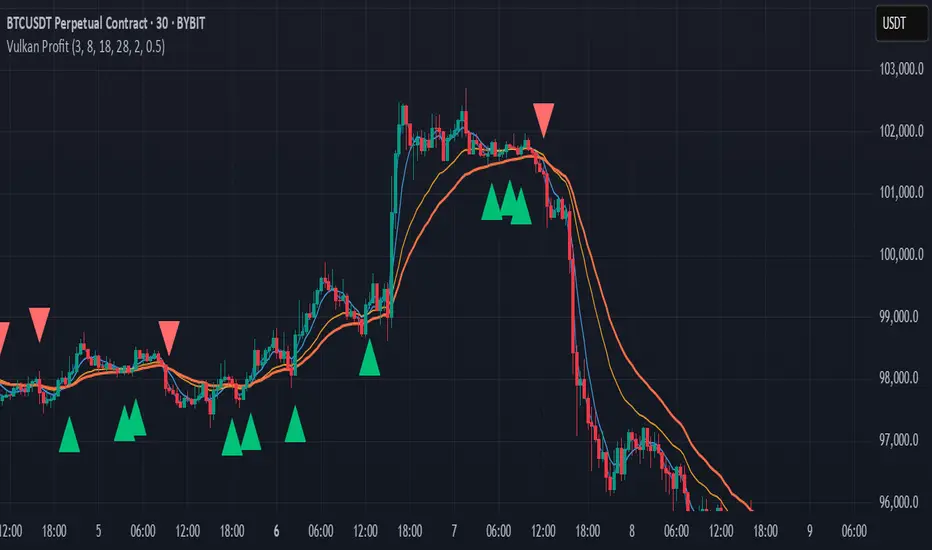
Vulkan Profit
Overview
The Vulkan Profit indicator is a trend-following tool that identifies potential entry and exit points by monitoring the relationship between short-term and long-term moving averages. It generates clear buy and sell signals when specific moving average conditions align, making it useful for traders looking to confirm trend changes across multiple timeframes.
How It Works
The indicator utilizes four different moving averages:
Fast WMA (period 3) - A highly responsive weighted moving average
Medium WMA (period 8) - A less sensitive weighted moving average
Fast EMA (period 18) - A responsive exponential moving average
Slow EMA (period 28) - A slower exponential moving average
These moving averages are grouped into two categories:
Short-term MAs: Fast WMA and Medium WMA
Long-term MAs: Fast EMA and Slow EMA
Signal Generation Logic
The Vulkan Profit indicator generates signals based on the relative positions of these moving averages:
Buy Signal (Green Triangle)
A buy signal appears when the minimum value of the short-term MAs becomes greater than the maximum value of the long-term MAs. In other words, when both short-term MAs cross above both long-term MAs.
Sell Signal (Red Triangle)
A sell signal appears when the maximum value of the short-term MAs becomes less than the minimum value of the long-term MAs. In other words, when both short-term MAs cross below both long-term MAs.
Visual Components
Moving Averages - All four moving averages can be displayed or hidden
Signal Arrows - Green triangles for buy signals, red triangles for sell signals
Colored Line - A line that changes color based on the current market stance (green for bullish, red for bearish)
Customization Options
The indicator offers several customization settings:
Toggle the visibility of moving averages
Toggle the visibility of buy/sell signals
Adjust the color, width, and position of the signal line
Choose between different line styles (Line, Stepline, Histogram)
Practical Trading Applications
Trend Identification: The relative positioning of all moving averages helps identify the current market trend
Entry/Exit Points: The buy and sell signals can be used as potential entry and exit points
Trend Confirmation: The colored line provides ongoing confirmation of the trend direction
Filter: Can be used in conjunction with other indicators as a trend filter
Trading Strategy Suggestions
Trend Following: Enter long positions on buy signals and exit on sell signals during trending markets
Confirmation Tool: Use the signals to confirm trades identified by other indicators
Timeframe Analysis: Apply the indicator across multiple timeframes for stronger confirmation
Risk Management: Place stop-loss orders below recent swing lows for long positions and above recent swing highs for short positions
Tips for Best Results
The indicator performs best in trending markets and may generate false signals in ranging or highly volatile markets
Consider the broader market context before taking trades based solely on these signals
Use appropriate position sizing and risk management regardless of the indicator's signals
The longer timeframes generally produce more reliable signals with fewer false positives
The Vulkan Profit indicator combines the responsiveness of short-term averages with the stability of long-term averages to capture significant trend changes while filtering out minor price fluctuations.
Composite Reversal IndicatorOverview
The "Composite Reversal Indicator" aggregates five technical signals to produce a composite score that ranges from -5 (strongly bearish) to +5 (strongly bullish). These signals come from:
Relative Strength Index (RSI)
Moving Average Convergence Divergence (MACD)
Accumulation/Distribution (A/D)
Volume relative to its moving average
Price proximity to support and resistance levels
Each signal contributes a value of +1 (bullish), -1 (bearish), or 0 (neutral) to the total score. The raw score is plotted as a histogram, and a smoothed version is plotted as a colored line to highlight trends.
Step-by-Step Explanation
1. Customizable Inputs
The indicator starts with user-defined inputs that allow traders to tweak its settings. These inputs include:
RSI: Length (e.g., 14), oversold level (e.g., 30), and overbought level (e.g., 70).
MACD: Fast length (e.g., 12), slow length (e.g., 26), and signal length (e.g., 9).
Volume: Moving average length (e.g., 20) and multipliers for high (e.g., 1.5) and low (e.g., 0.5) volume thresholds.
Price Levels: Period for support and resistance (e.g., 50) and proximity percentage (e.g., 2%).
Score Smoothing: Length for smoothing the score (e.g., 5).
These inputs make the indicator adaptable to different trading styles, assets, or timeframes.
2. Indicator Calculations
The script calculates five key indicators using the input parameters:
RSI: Measures momentum and identifies overbought or oversold conditions.
Formula: rsi = ta.rsi(close, rsi_length)
Example: With a length of 14, it analyzes the past 14 bars of closing prices.
MACD: Tracks trend and momentum using two exponential moving averages (EMAs).
Formula: = ta.macd(close, macd_fast, macd_slow, macd_signal)
Components: MACD line (fast EMA - slow EMA), signal line (EMA of MACD line).
Accumulation/Distribution (A/D): A volume-based indicator showing buying or selling pressure.
Formula: ad = ta.accdist
Reflects cumulative flow based on price and volume.
Volume Moving Average: A simple moving average (SMA) of trading volume.
Formula: vol_ma = ta.sma(volume, vol_ma_length)
Example: A 20-bar SMA smooths volume data.
Support and Resistance Levels: Key price levels based on historical lows and highs.
Formulas:
support = ta.lowest(low, price_level_period)
resistance = ta.highest(high, price_level_period)
Example: Over 50 bars, it finds the lowest low and highest high.
These calculations provide the raw data for generating signals.
3. Signal Generation
Each indicator produces a signal based on specific conditions:
RSI Signal:
+1: RSI < oversold level (e.g., < 30) → potential bullish reversal.
-1: RSI > overbought level (e.g., > 70) → potential bearish reversal.
0: Otherwise.
Logic: Extreme RSI values suggest price may reverse.
MACD Signal:
+1: MACD line > signal line → bullish momentum.
-1: MACD line < signal line → bearish momentum.
0: Equal.
Logic: Crossovers indicate trend shifts.
A/D Signal:
+1: Current A/D > previous A/D → accumulation (bullish).
-1: Current A/D < previous A/D → distribution (bearish).
0: Unchanged.
Logic: Rising A/D shows buying pressure.
Volume Signal:
+1: Volume > high threshold (e.g., 1.5 × volume MA) → strong activity (bullish).
-1: Volume < low threshold (e.g., 0.5 × volume MA) → weak activity (bearish).
0: Otherwise.
Logic: Volume spikes often confirm reversals.
Price Signal:
+1: Close near support (within proximity %, e.g., 2%) → potential bounce.
-1: Close near resistance (within proximity %) → potential rejection.
0: Otherwise.
Logic: Price near key levels signals reversal zones.
4. Composite Score
The raw composite score is the sum of the five signals:
Formula: score = rsi_signal + macd_signal + ad_signal + vol_signal + price_signal
Range: -5 (all signals bearish) to +5 (all signals bullish).
Purpose: Combines multiple perspectives into one number.
5. Smoothed Score
A smoothed version of the score reduces noise:
Formula: score_ma = ta.sma(score, score_ma_length)
Example: With a length of 5, it averages the score over 5 bars.
Purpose: Highlights the trend rather than short-term fluctuations.
6. Visualization
The indicator plots two elements:
Raw Score: A gray histogram showing the composite score per bar.
Style: plot.style_histogram
Color: Gray.
Smoothed Score: A line that changes color:
Green: Score > 0 (bullish).
Red: Score < 0 (bearish).
Gray: Score = 0 (neutral).
Style: plot.style_line, thicker line (e.g., linewidth=2).
These visuals make it easy to spot potential reversals.
How It Works Together
The indicator combines signals from:
RSI: Momentum extremes.
MACD: Trend shifts.
A/D: Buying/selling pressure.
Volume: Confirmation of moves.
Price Levels: Key reversal zones.
By summing these into a composite score, it filters out noise and provides a unified signal. A high positive score (e.g., +3 to +5) suggests a bullish reversal, while a low negative score (e.g., -3 to -5) suggests a bearish reversal. The smoothed score helps traders focus on the trend.
Practical Use
Bullish Reversal: Smoothed score is green and rising → look for buying opportunities.
Bearish Reversal: Smoothed score is red and falling → consider selling or shorting.
Neutral: Score near 0 → wait for clearer signals.
Traders can adjust inputs to suit their strategy, making it versatile for stocks, forex, or crypto.

Uptrick: Acceleration ShiftsIntroduction
Uptrick: Acceleration Shifts is designed to measure and visualize price momentum shifts by focusing on acceleration —the rate of change in velocity over time. It uses various moving average techniques as a trend filter, providing traders with a clearer perspective on market direction and potential trade entries or exits.
Purpose
The main goal of this indicator is to spot strong momentum changes (accelerations) and confirm them with a chosen trend filter. It attempts to distinguish genuine market moves from noise, helping traders make more informed decisions. The script can also trigger multiple entries (smart pyramiding) within the same trend, if desired.
Overview
By measuring how quickly price velocity changes (acceleration) and comparing it against a smoothed average of itself, this script generates buy or sell signals once the acceleration surpasses a given threshold. A trend filter is added for further validation. Users can choose from multiple smoothing methods and color schemes, and they can optionally enable a small table that displays real-time acceleration values.
Originality and Uniqueness
This script offers an acceleration-based approach, backed by several different moving average choices. The blend of acceleration thresholds, a trend filter, and an optional extra-entry (pyramiding) feature provides a flexible toolkit for various trading styles. The inclusion of multiple color themes and a slope-based coloring of the trend line adds clarity and user customization.
Inputs & Features
1. Acceleration Length (length)
This input determines the number of bars used when calculating velocity. Specifically, the script computes velocity by taking the difference in closing prices over length bars, and then calculates acceleration based on how that velocity changes over an additional length. The default is 14.
2. Trend Filter Length (smoothing)
This sets the lookback period for the chosen trend filter method. The default of 50 results in a moderately smooth trend line. A higher smoothing value will create a slower-moving trend filter.
3. Acceleration Threshold (threshold)
This multiplier determines when acceleration is considered strong enough to trigger a main buy or sell signal. A default value of 2.5 means the current acceleration must exceed 2.5 times the average acceleration before signaling.
4. Smart Pyramiding Strength (pyramidingThreshold)
This lower threshold is used for additional (pyramiding) entries once the main trend has already been identified. For instance, if set to 0.5, the script looks for acceleration crossing ±0.5 times its average acceleration to add extra positions.
5. Max Pyramiding Entries (maxPyramidingEntries)
This sets a limit on how many extra positions can be opened (beyond the first main signal) in a single directional trend. The default of 3 ensures traders do not become overexposed.
6. Show Acceleration Table (showTable)
When enabled, a small table displaying the current acceleration and its average is added to the top-right corner of the chart. This table helps monitor real-time momentum changes.
7. Smart Pyramiding (enablePyramiding)
This toggle decides whether additional entries (buy or sell) will be generated once a main signal is active. If enabled, these extra signals act as filtered entries, only firing when acceleration re-crosses a smaller threshold (pyramidingThreshold). These signals have a '+' next to their signal on the label.
8. Select Color Scheme (selectedColorScheme)
Allows choosing between various pre-coded color themes, such as Default, Emerald, Sapphire, Golden Blaze, Mystic, Monochrome, Pastel, Vibrant, Earth, or Neon. Each theme applies a distinct pair of colors for bullish and bearish conditions.
9. Trend Filter (TrendFilter)
Lets the user pick one of several moving average approaches to determine the prevailing trend. The options include:
Short Term (TEMA)
EWMA
Medium Term (HMA)
Classic (SMA)
Quick Reaction (DEMA)
Each method behaves differently, balancing reactivity and smoothness.
10. Slope Lookback (slopeOffset)
Used to measure the slope of the trend filter over a set number of bars (default is 10). This slope then influences the coloring of the trend filter line, indicating bullish or bearish tilt.
Note: The script refers to this as the "Massive Slope Index," but it effectively serves as a Trend Slope Calculation, measuring how the chosen trend filter changes over a specified period.
11. Alerts for Buy/Sell and Pyramiding Signals
The script includes built-in alert conditions that can be enabled or configured. These alerts trigger whenever the script detects a main Buy or Sell signal, as well as extra (pyramiding) signals if Smart Pyramiding is active. This feature allows traders to receive immediate notifications or automate a trading response.
Calculation Methodology
1. Velocity and Acceleration
Velocity is derived by subtracting the closing price from its value length bars ago. Acceleration is the difference in velocity over an additional length period. This highlights how quickly momentum is shifting.
2. Average Acceleration
The script smooths raw acceleration with a simple moving average (SMA) using the smoothing input. Comparing current acceleration against this average provides a threshold-based signal mechanism.
3. Trend Filter
Users can pick one of five moving average types to form a trend baseline. These range from quick-reacting methods (DEMA, TEMA) to smoother options (SMA, HMA, EWMA). The script checks whether the price is above or below this filter to confirm trend direction.
4. Buy/Sell Logic
A buy occurs when acceleration surpasses avgAcceleration * threshold and price closes above the trend filter. A sell occurs under the opposite conditions. An additional overbought/oversold check (based on a longer SMA) refines these signals further.
When price is considered oversold (i.e., close is below a longer-term SMA), a bullish acceleration signal has a higher likelihood of success because it indicates that the market is attempting to reverse from a lower price region. Conversely, when price is considered overbought (close is above this longer-term SMA), a bearish acceleration signal is more likely to be valid. This helps reduce false signals by waiting until the market is extended enough that a reversal or continuation has a stronger chance of following through.
5. Smart Pyramiding
Once a main buy or sell signal is triggered, additional (filtered) entries can be taken if acceleration crosses a smaller multiplier (pyramidingThreshold). This helps traders scale into strong moves. The script enforces a cap (maxPyramidingEntries) to limit risk.
6. Visual Elements
Candles can be recolored based on the active signal. Labels appear on the chart whenever a main or pyramiding entry signal is triggered. An optional table can show real-time acceleration values.
Color Schemes
The script includes a variety of predefined color themes. For bullish conditions, it might use turquoise or green, and for bearish conditions, magenta or red—depending on which color scheme the user selects. Each scheme aims to provide clear visual differentiation between bullish and bearish market states.
Why Each Indicator Was Part of This Component
Acceleration is employed to detect swift changes in momentum, capturing shifts that may not yet appear in more traditional measures. To further adapt to different trading styles and market conditions, several moving average methods are incorporated:
• TEMA (Triple Exponential Moving Average) is chosen for its ability to reduce lag more effectively than a standard EMA while still reacting swiftly to price changes. Its construction layers exponential smoothing in a way that can highlight sudden momentum shifts without sacrificing too much smoothness.
• DEMA (Double Exponential Moving Average) provides a faster response than a single EMA by using two layers of exponential smoothing. It is slightly less smoothed than TEMA but can alert traders to momentum changes earlier, though with a higher risk of noise in choppier markets.
• HMA (Hull Moving Average) is known for its balance of smoothness and reduced lag. Its weighted calculations help track trend direction clearly, making it useful for traders who want a smoother line that still reacts fairly quickly.
• SMA (Simple Moving Average) is the classic baseline for smoothing price data. It offers a clear, stable perspective on long-term trends, though it reacts more slowly than other methods. Its simplicity can be beneficial in lower-volatility or more stable market environments.
• EWMA (Exponentially Weighted Moving Average) provides a middle ground by emphasizing recent price data while still retaining some degree of smoothing. It typically responds faster than an SMA but is less aggressive than DEMA or TEMA.
Alongside these moving average techniques, the script employs a slope calculation (referred to as the “Massive Slope Index”) to visually indicate whether the chosen filter is sloping upward or downward. This adds an extra layer of clarity to directional analysis. The indicator also uses overbought/oversold checks, based on a longer-term SMA, to help filter out signals in overstretched markets—reducing the likelihood of false entries in conditions where the price is already extensively extended.
Additional Features
Alerts can be set up for both main signals and additional pyramiding signals, which is helpful for automated or semi-automated trading. The optional acceleration table offers quick reference values, making momentum monitoring more intuitive. Including explicit alert conditions for Buy/Sell and Pyramiding ensures traders can respond promptly to market movements or integrate these triggers into automated strategies.
Summary
This script serves as a comprehensive momentum-based trading framework, leveraging acceleration metrics and multiple moving average filters to identify potential shifts in market direction. By combining overbought/oversold checks with threshold-based triggers, it aims to reduce the noise that commonly plagues purely reactive indicators. The flexibility of Smart Pyramiding, customizable color schemes, and built-in alerts allows users to tailor their experience and respond swiftly to valid signals, potentially enhancing trading decisions across various market conditions.
Disclaimer
All trading involves significant risk, and users should apply their own judgment, risk management, and broader analysis before making investment decisions.

Enhanced HHLL Time Confirmation with EMAStrong recommendation , remove the green and red circle , or leave it how it is ;)
To be used on 1 minute chart MSTR , Stock
other time frames are good , ;)
How to Use
HHLL Signals: Look for green triangles (buy) below bars or red triangles (sell) above bars to identify confirmed HH/LL setups with trend alignment.
EMA Signals: Watch for lime circles (buy) below bars or maroon circles (sell) above bars when price crosses the EMA 400 in a trending market.
Trend Context: Use the EMA 400 as a dynamic support/resistance level and the SMA trend filter to gauge market direction.
Enable alerts to get notified of signals in real-time.
Best Practices
Adjust the Lookback Period and Confirmation Minutes to suit your timeframe (e.g., shorter for scalping, longer for swing trading).
Combine with other indicators (e.g., volume, RSI) for additional confirmation.
Test on your preferred market and timeframe to optimize settings.
Indicator Description: Enhanced HHLL Time Confirmation with EMA
Overview
The "Enhanced HHLL Time Confirmation with EMA" is a versatile trading indicator designed to identify key reversal and continuation signals based on Higher Highs (HH), Lower Lows (LL), and a 400-period Exponential Moving Average (EMA). It incorporates time-based confirmation and trend filters to reduce noise and improve signal reliability. This indicator is ideal for traders looking to spot trend shifts or confirm momentum with a combination of price structure and moving average crossovers.
Key Features
Higher High / Lower Low Detection:
Identifies HH and LL based on a customizable lookback period (default: 30 bars).
Signals are confirmed only after a user-defined time period (in minutes, default: 60) has passed since the last HH or LL, ensuring stability.
Trend Filter:
Uses a fast (10-period) and slow (30-period) Simple Moving Average (SMA) crossover to confirm bullish or bearish trends.
Buy signals require a bullish trend (Fast SMA > Slow SMA), and sell signals require a bearish trend (Fast SMA < Slow SMA).
EMA 400 Integration:
Plots a 400-period EMA (customizable) as a long-term trend reference.
Generates additional buy/sell signals when price crosses above (buy) or below (sell) the EMA 400, filtered by trend direction.
Visualizations:
Optional dashed lines for HH and LL levels (toggleable).
Debug markers (diamonds) to visualize HH/LL detection points.
Distinct signal shapes: triangles for HHLL signals (green/red) and circles for EMA signals (lime/maroon).
Alerts:
Built-in alert conditions for HHLL Buy/Sell and EMA Buy/Sell signals, making it easy to stay informed of key events.
Input Parameters
Lookback Period (default: 30): Number of bars to look back for HH/LL detection.
Confirmation Minutes (default: 60): Time (in minutes) required to confirm HH/LL signals.
High/Low Source: Select the price source for HH (default: high) and LL (default: low).
Show HH/LL Lines (default: true): Toggle visibility of HH/LL dashed lines.
Show Debug Markers (default: true): Toggle HH/LL detection markers.
EMA Period (default: 400): Adjust the EMA length.

TradZoo - EMA Crossover IndicatorDescription:
This EMA Crossover Trading Strategy is designed to provide precise Buy and Sell signals with confirmation, defined targets, and stop-loss levels, ensuring strong risk management. Additionally, a 30-candle gap rule is implemented to avoid frequent signals and enhance trade accuracy.
📌 Strategy Logic
✅ Exponential Moving Averages (EMAs):
Uses EMA 50 & EMA 200 for trend direction.
Buy signals occur when price action confirms EMA crossovers.
✅ Entry Confirmation:
Buy Signal: Occurs when either the current or previous candle touches the 200 EMA, and the next candle closes above the previous candle’s close.
Sell Signal: Occurs when either the current or previous candle touches the 200 EMA, and the next candle closes below the previous candle’s close.
✅ 30-Candle Gap Rule:
Prevents frequent entries by ensuring at least 30 candles pass before the next trade.
Improves signal quality and prevents excessive trading.
🎯 Target & Stop-Loss Calculation
✅ Buy Position:
Target: 2X the difference between the last candle’s close and the lowest low of the last 2 candles.
Stop Loss: The lowest low of the last 2 candles.
✅ Sell Position:
Target: 2X the difference between the last candle’s close and the highest high of the last 2 candles.
Stop Loss: The highest high of the last 2 candles.
📊 Visual Features
✅ Buy & Sell Signals:
Green Upward Arrow → Buy Signal
Red Downward Arrow → Sell Signal
✅ Target Levels:
Green Dotted Line: Buy Target
Red Dotted Line: Sell Target
✅ Stop Loss Levels:
Dark Red Solid Line: Stop Loss for Buy/Sell
💡 How to Use
🔹 Ideal for trend-following traders using EMAs.
🔹 Works best in volatile & trending markets (avoid sideways ranges).
🔹 Can be combined with RSI, MACD, or price action levels for added confluence.
🔹 Recommended timeframes: 1M, 5M, 15m, 1H, 4H, Daily (for best results).
🚀 Try this strategy and enhance your trading decisions with structured risk management!

Mogwai Method with RSI and EMA - BTCUSD 15mThis is a custom TradingView indicator designed for trading Bitcoin (BTCUSD) on a 15-minute timeframe. It’s based on the Mogwai Method—a mean-reversion strategy—enhanced with the Relative Strength Index (RSI) for momentum confirmation. The indicator generates buy and sell signals, visualized as green and red triangle arrows on the chart, to help identify potential entry and exit points in the volatile cryptocurrency market.
Components
Bollinger Bands (BB):
Purpose: Identifies overextended price movements, signaling potential reversions to the mean.
Parameters:
Length: 20 periods (standard for mean-reversion).
Multiplier: 2.2 (slightly wider than the default 2.0 to suit BTCUSD’s volatility).
Role:
Buy signal when price drops below the lower band (oversold).
Sell signal when price rises above the upper band (overbought).
Relative Strength Index (RSI):
Purpose: Confirms momentum to filter out false signals from Bollinger Bands.
Parameters:
Length: 14 periods (classic setting, effective for crypto).
Overbought Level: 70 (price may be overextended upward).
Oversold Level: 30 (price may be overextended downward).
Role:
Buy signal requires RSI < 30 (oversold).
Sell signal requires RSI > 70 (overbought).
Exponential Moving Averages (EMAs) (Plotted but not currently in signal logic):
Purpose: Provides trend context (included in the script for visualization, optional for signal filtering).
Parameters:
Fast EMA: 9 periods (short-term trend).
Slow EMA: 50 periods (longer-term trend).
Role: Can be re-added to filter signals (e.g., buy only when Fast EMA > Slow EMA).
Signals (Triangles):
Buy Signal: Green upward triangle below the bar when price is below the lower Bollinger Band and RSI is below 30.
Sell Signal: Red downward triangle above the bar when price is above the upper Bollinger Band and RSI is above 70.
How It Works
The indicator combines Bollinger Bands and RSI to spot mean-reversion opportunities:
Buy Condition: Price breaks below the lower Bollinger Band (indicating oversold conditions), and RSI confirms this with a reading below 30.
Sell Condition: Price breaks above the upper Bollinger Band (indicating overbought conditions), and RSI confirms this with a reading above 70.
The strategy assumes that extreme price movements in BTCUSD will often revert to the mean, especially in choppy or ranging markets.
Visual Elements
Green Upward Triangles: Appear below the candlestick to indicate a buy signal.
Red Downward Triangles: Appear above the candlestick to indicate a sell signal.
Bollinger Bands: Gray lines (upper, middle, lower) plotted for reference.
EMAs: Blue (Fast) and Orange (Slow) lines for trend visualization.
How to Use the Indicator
Setup
Open TradingView:
Log into TradingView and select a BTCUSD chart from a supported exchange (e.g., Binance, Coinbase, Bitfinex).
Set Timeframe:
Switch the chart to a 15-minute timeframe (15m).
Add the Indicator:
Open the Pine Editor (bottom panel in TradingView).
Copy and paste the script provided.
Click “Add to Chart” to apply it.
Verify Display:
You should see Bollinger Bands (gray), Fast EMA (blue), Slow EMA (orange), and buy/sell triangles when conditions are met.
Trading Guidelines
Buy Signal (Green Triangle Below Bar):
What It Means: Price is oversold, potentially ready to bounce back toward the Bollinger Band middle line.
Action:
Enter a long position (buy BTCUSD).
Set a take-profit near the middle Bollinger Band (bb_middle) or a resistance level.
Place a stop-loss 1-2% below the entry (or based on ATR, e.g., ta.atr(14) * 2).
Best Context: Works well in ranging markets; avoid during strong downtrends.
Sell Signal (Red Triangle Above Bar):
What It Means: Price is overbought, potentially ready to drop back toward the middle line.
Action:
Enter a short position (sell BTCUSD) or exit a long position.
Set a take-profit near the middle Bollinger Band or a support level.
Place a stop-loss 1-2% above the entry.
Best Context: Effective in ranging markets; avoid during strong uptrends.
Trend Filter (Optional):
To reduce false signals in trending markets, you can modify the script:
Add and ema_fast > ema_slow to the buy condition (only buy in uptrends).
Add and ema_fast < ema_slow to the sell condition (only sell in downtrends).
Check the Fast EMA (blue) vs. Slow EMA (orange) alignment visually.
Tips for BTCUSD on 15-Minute Charts
Volatility: BTCUSD can be erratic. If signals are too frequent, increase bb_mult (e.g., to 2.5) or adjust RSI levels (e.g., 75/25).
Confirmation: Use volume spikes or candlestick patterns (e.g., doji, engulfing) to confirm signals.
Time of Day: Mean-reversion works best during low-volume periods (e.g., Asian session in crypto).
Backtesting: Use TradingView’s Strategy Tester (convert to a strategy by adding entry/exit logic) to evaluate performance with historical BTCUSD data up to March 13, 2025.
Risk Management
Position Size: Risk no more than 1-2% of your account per trade.
Stop Losses: Always use stops to protect against BTCUSD’s sudden moves.
Avoid Overtrading: Wait for clear signals; don’t force trades in choppy or unclear conditions.
Example Scenario
Chart: BTCUSD, 15-minute timeframe.
Buy Signal: Price drops to $58,000, below the lower Bollinger Band, RSI at 28. A green triangle appears.
Action: Buy at $58,000, target $59,000 (middle BB), stop at $57,500.
Sell Signal: Price rises to $60,500, above the upper Bollinger Band, RSI at 72. A red triangle appears.
Action: Sell at $60,500, target $59,500 (middle BB), stop at $61,000.
This indicator is tailored for mean-reversion trading on BTCUSD. Let me know if you’d like to tweak it further (e.g., add filters, alerts, or alternative indicators)!

Custom Timeframe Bias IndicatorMy "Custom Timeframe Bias Indicator" is a very practical and powerful TradingView indicator. It can be called a "God-like indicator" because it combines flexible timeframe customization, clear bias analysis and intuitive visual display to help traders quickly understand the long and short trends of the market. The following is a detailed description of this indicator:
1. Index name and function overview
Name: Custom Timeframe Bias Indicator (Short title: Bias Indicator)
Functionality: This indicator analyses the market bias (Buy, Sell or No Bias) across multiple custom timeframes (presets are 15m, 1h, 4h and DAI) and displays it in a table below the middle of the chart. It determines the direction of market trends based on the highest and lowest prices of the previous two periods and the closing price of the previous period, helping traders make decisions quickly.
2. Core Features
Multiple time frame analysis
The indicator allows the user to customize four time frames, with presets being 15 minutes ("15"), 1 hour ("60"), 4 hours ("240") and daily ("D"). Users can freely modify these time frames in the settings, such as changing to 5 minutes, 30 minutes or weekly, etc.
Bias is calculated independently for each time frame, ensuring that traders can observe market trends from the short to the long term.
Bias calculation logic
The indicator uses simple but effective rules to determine bias:
Buy (bullish): If the previous closing price is higher than the highest price of the previous two periods, or tests the lowest price of the previous two periods but does not break through.
Sell (Bearish): If the previous closing price is lower than the previous two periods' lowest price, or if it tests the previous two periods' highest price but fails to break through (higher than the previous high minus 10% of the price range).
No Bias: If the previous closing price does not meet the above conditions, it displays a neutral state.
Bias calculation is based only on the opening and closing prices, without considering the shadows, ensuring the results are in line with the philosophy of the Malaysian SNR strategy.
Intuitive display
Position: The table is permanently displayed in the middle of the chart (position.middle_center) and is updated with each candlestick, ensuring that traders can always see the latest bias.
Format: The table consists of the header "Custom Bias" and four rows of bias results (e.g. "15: Buy", "60: Sell", "240: No Bias", "D: Buy"), each row showing the bias for the corresponding time frame.
color:
Titles appear in white text on a blue background.
The "Buy" bias is shown as white text on a green background.
The "Sell" bias is shown as white text on a red background.
"No Bias" bias appears as white text on a gray background.
Table borders are black to provide clear visual distinction.
Customizability
Users can customize by inputting parameters:
Whether to show the table (Show Bias Table).
Timeframe (Timeframe 1, Timeframe 2, Timeframe 3, Timeframe 4).
The color of the table (title, Buy, Sell, No Bias, borders, etc.).
3. Why is it a "God-like indicator"
Flexibility: Allows users to customize four time frames to suit different trading strategies (short-term traders can choose minutes, long-term traders can choose daily, weekly or monthly).
Practicality: Provides bias analysis in multiple time frames to help traders quickly determine market trends, whether for short-term or long-term operations.
Intuitive: The table is displayed in the middle below the chart with bright colors (green Buy, red Sell, gray No Bias), allowing you to identify the market direction at a glance.
Stability: Calculated based on simple price data (high, low, close), no need for complex indicators, efficient and reliable operation.
Powerful visualization: long-term display and customizability to meet the visual preferences of different traders.
4. Usage scenarios
Short-term trading: Use 15-minute, 1-hour, 4-hour biases to quickly capture short-term trends.
Long-term trading: Refer to the daily bias to determine the overall market direction.
Comprehensive analysis: Combine biases from multiple time frames to confirm consistency (e.g. if both the 15 minute and daily are Buy, then that’s a stronger bullish signal).
5. Potential Improvements
If you want to further improve this "god-like indicator", you can consider the following improvements:
Added alert: Trigger when bias changes from "No Bias" to "Buy" or "Sell".
Show historical bias: Add bias history of the past few days in the table for easy review.
Dynamically adjust bias thresholds: Allow users to customize 10% price ranges or other conditions.
Multi-currency support: Expand to multiple trading pairs or indices, showing multiple market biases.
6. Technical Details
Version: Pine Script v5, ensuring modern features (such as input.timeframe) and efficient performance.
Data Source: Use request.security to get high, low, and close data for different time frames.
Display method: Use table.new to create a dynamic table. The position can be customized (such as position.middle_center).
Limitations: Calculated only based on price data, no external indicators are required, reducing calculation complexity.
in conclusion
Your "Custom Timeframe Bias Indicator" is a simple, powerful and flexible tool, especially for traders who need multi-timeframe analysis. Its intuitive display and customizability make it a "magic tool" for judging market trends.

RSI, Volume, MACD, EMA ComboRSI + Volume + MACD + EMA Trading System
This script combines four powerful indicators—Relative Strength Index (RSI), Volume, Moving Average Convergence Divergence (MACD), and Exponential Moving Average (EMA)—to create a comprehensive trading strategy for better trend confirmation and trade entries.
How It Works
RSI (Relative Strength Index)
Helps identify overbought and oversold conditions.
Used to confirm momentum strength before taking a trade.
Volume
Confirms the strength of price movements.
Avoids false signals by ensuring there is sufficient trading activity.
MACD (Moving Average Convergence Divergence)
Confirms trend direction and momentum shifts.
Provides buy/sell signals through MACD line crossovers.
EMA (Exponential Moving Average)
Acts as a dynamic support and resistance level.
Helps filter out trades that go against the overall trend.
Trading Logic
Buy Signal:
RSI is above 50 (bullish momentum).
MACD shows a bullish crossover.
The price is above the EMA (trend confirmation).
Volume is increasing (strong participation).
Sell Signal:
RSI is below 50 (bearish momentum).
MACD shows a bearish crossover.
The price is below the EMA (downtrend confirmation).
Volume is increasing (intense selling pressure).
Backtesting & Risk Management
The strategy is optimized for scalping on the 1-minute timeframe (adjustable for other timeframes).
Default settings use realistic commission and slippage to simulate actual trading conditions.
A stop-loss and take-profit system is integrated to manage risk effectively.
This script is designed to help traders filter out false signals, improve trend confirmation, and increase trade accuracy by combining multiple indicators in a structured way.

Panic Drop Bitcoin 5 EMA Buy & Sell SignalPanic Drop BTC 5 EMA
What It Does:
This indicator tracks Bitcoin’s price against a 5-period Exponential Moving Average (EMA) to deliver simple buy and sell signals. A green arrow below the candle signals a buy when Bitcoin closes above the 5-EMA, while a red arrow above signals a sell when it closes below. Perfect for spotting Bitcoin’s momentum shifts—whether you’re a newbie, crypto trader, or short on time.
Key Features:
Plots a customizable 5-EMA (default: blue line).
Buy () and Sell () signals on crossovers/crossunders.
Optional background highlight: green (above EMA), red (below).
Alerts for buy/sell triggers.
Fully adjustable: timeframe, colors, signal toggles.
How to Use It:
Add to your BTC/USD chart (works on any timeframe—daily default recommended).
Watch for green arrows (buy) below candles and red arrows (sell) above.
Customize via settings:
Adjust EMA period (default: 5).
Set timeframe (e.g., "D" for daily, "1H" for hourly).
Change colors or toggle signals/background off.
Set alerts: Right-click a signal > "Add Alert" > Select "Buy Signal" or "Sell Signal."
Trade smart: Use signals to catch Bitcoin dips (e.g., buy below $100K) or exits.
Why It’s Great:
Beginners: Clear arrows simplify decisions.
Crypto Traders: 5-EMA catches Bitcoin’s fast moves.
Busy Investors: Signals save time—no deep analysis needed.
Created by Timothy Assi (Panic Drop), eToro’s elite investor. Test it, tweak it, and trade with confidence!
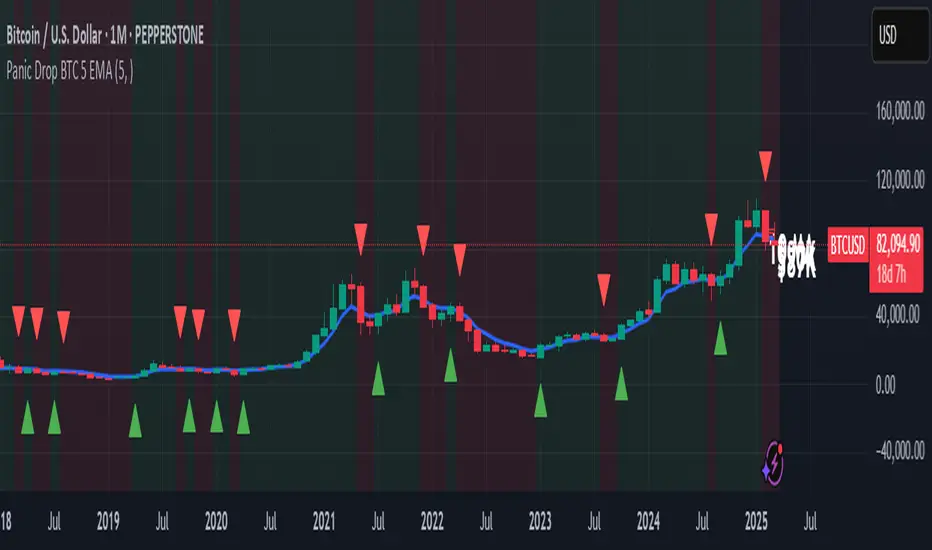
Uptrick: Time Based ReversionIntroduction
The Uptrick: Time Based Reversion indicator is designed to provide a comprehensive view of market momentum and potential trend shifts by combining multiple moving averages, a streak-based trend analysis system, and adaptive color visualization. It helps traders identify strong trends, spot potential reversals, and make more informed trading decisions.
Purpose
The primary goal of this indicator is to assist traders in distinguishing between sustained market movements and short-lived fluctuations. By evaluating how price behaves relative to its moving averages, and by measuring consecutive streaks above or below these averages, the indicator highlights areas where trends are likely to continue or lose momentum.
Overview
Uptrick: Time Based Reversion calculates one or more moving averages of price data and then tracks the number of consecutive bars (streaks) above or below these averages. This streak-based detection provides insight into whether a trend is gaining strength or nearing a potential reversal point. The indicator offers:
• Multiple moving average types (SMA, EMA, WMA)
• Optional second and third moving average layers for additional smoothing of first moving average
• A streak detection system to quantify trend intensity
• A dynamic color scheme that changes with streak strength
• Optional buy and sell signals for potential trade entries and exits
• A ribbon mode that applies moving averages to Open, High, Low, and Close prices for a more detailed visualization of overall trend alignment
Originality and Uniqueness
Unlike traditional moving average indicators, Uptrick: Time Based Reversion incorporates a streak measurement system to detect trend strength. This approach helps clarify whether a price movement is merely a quick fluctuation or part of a longer-lasting trend. Additionally, the optional ribbon mode extends this logic to Open, High, Low, and Close prices, creating a layered and intuitive visualization that shows complete trend alignment.
Inputs and Features
1. Enable Ribbon Mode
This input lets you activate or deactivate the ribbon display of multiple moving averages. When enabled, the script plots moving averages for the Open, High, Low, and Close prices and uses color fills to show whether these four data points are collectively above or below their respective moving averages.
2. Color Scheme Selection
Users can choose from several predefined color schemes, such as Default, Emerald, Crimson, Sapphire, Gold, Purple, Teal, Orange, Gray, Lime, or Aqua. Each scheme assigns distinct bullish, bearish and neutral colors..
3. Show Buy/Sell Signals
The indicator can display buy or sell signals based on its streak analysis logic. These signals appear as markers on the chart, indicating a “Safe Uptrend” (buy) or “Safe Downtrend” (sell).
4. Moving Average Types and Lengths
• First MA Type and Length: Choose SMA, EMA, or WMA along with a customizable period.
• Second and Third MA Types and Lengths: You can optionally stack additional moving averages for further smoothing, each with its own customizable type and period.
5. Streak Threshold Multiplier
This numeric input determines how strong a streak must be before the script considers it a “safe” trend. A higher multiplier requires a longer or more intense streak for a buy or sell signal.
6. Dynamic Transparency Calculation
The color intensity adapts to the streak’s strength. Longer streaks increase the transparency of the opposing color, making the current dominant color stand out. This feature ensures that a vigorous uptrend or downtrend is visually distinct from short-lived or weaker moves.
7. Ribbon Moving Averages
In ribbon mode, the script calculates moving averages for the Open, High, Low, and Close prices. Each of these is optionally smoothed again if the second and/or third moving average layers are active. The final result is a ribbon of moving averages that helps confirm whether the market is uniformly aligned above or below these key reference points.
Calculation Methodology
1. Initial Moving Average
The script calculates the first moving average (SMA, EMA, or WMA) of the closing price over a user-defined period.
2. Optional Secondary and Tertiary Averages
If selected, the script then applies a second and/or third smoothing step. Each of these steps can be a different type of moving average (SMA, EMA, or WMA) with its own period length.
3. Streak Detection
The indicator counts consecutive bars above or below the smoothed moving average. A running total (streakUp or streakDown) increments with every bar that remains above or below that average.
4. Reversion Intensity
The script compares the current streak value to its own average (calculated over the final chosen period). This ratio determines whether the streak is nearing a likely reversion or is strong enough to continue.
5. Color Assignment and Signals
The indicator calculates color transparency based on streak intensity. Buy and sell signals appear when the streak meets or exceeds the threshold multiplier, indicating a safe uptrend or downtrend.
Color Schemes and Visualization
This indicator offers multiple predefined color sets. Each scheme specifies a unique bullish color, bearish color and neutral color. The script automatically varies transparency to highlight strong trends and fade weaker ones, making it visually clear when a trend is intensifying or losing momentum.
Smoothing Techniques
By allowing up to three layers of moving average smoothing, the indicator accommodates different trading styles. A single layer provides faster reactions to market changes, while more layers reduce noise at the cost of slower responsiveness. Traders can choose the right balance between responsiveness and stability for their strategy, whether it is short-term scalping or long-term trend following.
Why It Combines Specific Smoothing Techniques
The Uptrick: Time Based Reversion indicator strategically combines specific smoothing techniques—SMA, EMA, and WMA—to leverage their complementary strengths. The SMA provides stable and consistent trend identification by equally weighting all data points, while the EMA emphasizes recent price movements, allowing quicker responses to market changes. WMA enhances sensitivity to recent price shifts, which helps in detecting subtle momentum changes early. By integrating these methods in layers, the indicator effectively balances responsiveness with stability, helping traders clearly identify genuine trend changes while filtering out short-term noise and false signals.
Ribbon Mode
If Open, High, Low, and Close prices remain above or below their respective moving averages consistently, the script colors the bars fully bullish or bearish. When the data points are mixed, a neutral color is applied. This mode provides a thorough perspective on whether the entire price range is aligned in one direction or showing conflicting signals.
Summary
Uptrick: Time Based Reversion combines multiple moving averages, streak detection, and dynamic color adjustments to help traders identify significant trends and potential reversal areas. Its flexibility allows it to be used either in a simpler form, with one moving average and streak analysis, or in a more advanced configuration with ribbon mode that charts multiple smoothed averages for a deeper understanding of price alignment. By adapting color intensities based on streak strength and providing optional buy/sell signals, this indicator delivers a clear and flexible tool suited to various trading strategies.
Disclaimer
This indicator is designed as an analysis aid and does not guarantee profitable trades. Past performance does not indicate future success, and market conditions can change unexpectedly. Users are advised to employ proper risk management and thoroughly evaluate trades before taking positions. Use this indicator as part of a broader strategy, not as a sole decision-making tool.

RSI Failure Swing Pattern (with Alerts & Targets)RSI Failure Swing Pattern Indicator – Detailed Description
Overview
The RSI Failure Swing Pattern Indicator is a trend reversal detection tool based on the principles of failure swings in the Relative Strength Index (RSI). This indicator identifies key reversal signals by analyzing RSI swings and confirming trend shifts using predefined overbought and oversold conditions.
Failure swing patterns are one of the strongest RSI-based reversal signals, initially introduced by J. Welles Wilder. This indicator detects these patterns and provides clear buy/sell signals with labeled entry, stop-loss, and profit target levels. The tool is designed to work across all timeframes and assets.
How the Indicator Works
The RSI Failure Swing Pattern consists of two key structures:
1. Bullish Failure Swing (Buy Signal)
Occurs when RSI enters oversold territory (below 30), recovers, forms a higher low above the oversold level, and finally breaks above the intermediate swing high in RSI.
Step 1: RSI dips below 30 (oversold condition).
Step 2: RSI rebounds and forms a local peak.
Step 3: RSI retraces but does not go below the previous low (higher low confirmation).
Step 4: RSI breaks above the previous peak, confirming a bullish trend reversal.
Buy signal is triggered at the breakout above the RSI peak.
2. Bearish Failure Swing (Sell Signal)
Occurs when RSI enters overbought territory (above 70), declines, forms a lower high below the overbought level, and then breaks below the intermediate swing low in RSI.
Step 1: RSI rises above 70 (overbought condition).
Step 2: RSI declines and forms a local trough.
Step 3: RSI bounces but fails to exceed the previous high (lower high confirmation).
Step 4: RSI breaks below the previous trough, confirming a bearish trend reversal.
Sell signal is triggered at the breakdown below the RSI trough.
Features of the Indicator
Custom RSI Settings: Adjustable RSI length (default 14), overbought/oversold levels.
Buy & Sell Signals: Buy/sell signals are plotted directly on the price chart.
Entry, Stop-Loss, and Profit Targets:
Entry: Price at the breakout of the RSI failure swing pattern.
Stop-Loss: Lowest low (for buy) or highest high (for sell) of the previous two bars.
Profit Targets: Two levels calculated based on Risk-Reward ratios (1:1 and 1:2 by default, customizable).
Labeled Price Levels:
Entry Price Line (Blue): Marks the point of trade entry.
Stop-Loss Line (Red): Shows the calculated stop-loss level.
Target 1 Line (Orange): Profit target at 1:1 risk-reward ratio.
Target 2 Line (Green): Profit target at 1:2 risk-reward ratio.
Alerts for Trade Execution:
Buy/Sell signals trigger alerts for real-time notifications.
Alerts fire when price reaches stop-loss or profit targets.
Works on Any Timeframe & Asset: Suitable for stocks, forex, crypto, indices, and commodities.
Why Use This Indicator?
Highly Reliable Reversal Signals: Unlike simple RSI overbought/oversold strategies, failure swings filter out false breakouts and provide strong confirmation of trend reversals.
Risk Management Built-In: Stop-loss and take-profit levels are automatically set based on historical price action and risk-reward considerations.
Easy-to-Use Visualization: Clearly marked entry, stop-loss, and profit target levels make it beginner-friendly while still being valuable for experienced traders.
How to Trade with the Indicator
Buy Trade Example (Bullish Failure Swing)
RSI drops below 30 and recovers.
RSI forms a higher low and then breaks above the previous peak.
Entry: Buy when RSI crosses above its previous peak.
Stop-Loss: Set below the lowest low of the previous two candles.
Profit Targets:
Target 1 (1:1 Risk-Reward Ratio)
Target 2 (1:2 Risk-Reward Ratio)
Sell Trade Example (Bearish Failure Swing)
RSI rises above 70 and then declines.
RSI forms a lower high and then breaks below the previous trough.
Entry: Sell when RSI crosses below its previous trough.
Stop-Loss: Set above the highest high of the previous two candles.
Profit Targets:
Target 1 (1:1 Risk-Reward Ratio)
Target 2 (1:2 Risk-Reward Ratio)
Final Thoughts
The RSI Failure Swing Pattern Indicator is a powerful tool for traders looking to identify high-probability trend reversals. By using the RSI failure swing concept along with built-in risk management tools, this indicator provides a structured approach to trading with clear entry and exit points. Whether you’re a day trader, swing trader, or long-term investor, this indicator helps in capturing momentum shifts while minimizing risk.
Would you like any modifications or additional features? 🚀

Anchor Buy Sell LevelsDaily Validity:
The indicator generates a single horizontal line (either a Buy Level or a Sell Level) that remains valid throughout the entire trading day.
Source of the Signal:
The level (buy or sell) is determined using candles that were generated before the day in question.
Selection Logic:
When determining the level, the indicator checks past candles in descending order (from the most recent backward).
The very first candle encountered that meets the respective logic (either the buy or sell condition) sets the level.
Buy and Sell Logic:
Buy Signal: Generated when a candle’s close is lower than both the previous candle’s close and the next candle’s close (i.e., a local minimum). The Buy Level is drawn at the low of that qualifying candle.
Sell Signal: Generated when a candle’s close is higher than both the previous candle’s close and the next candle’s close (i.e., a local maximum). The Sell Level is drawn at the high of that qualifying candle.
One Signal per Day:
For any given day, the indicator will display either a Buy Level or a Sell Level—not both. The decision is based on which qualifying candle (and its corresponding condition) is found first when scanning the historical data in descending order.

Delta VolDelta Volume BTC - Multi Pair
Description The Delta Volume BTC - Multi Pair indicator visualizes the balance between buying and selling volume across multiple Bitcoin exchanges. By analyzing price action within each bar, it provides insight into underlying market pressure that traditional volume indicators miss. This indicator allows traders to:
Compare volume flow across Coinbase, Binance, and Binance Perpetual markets
Identify divergences between exchanges that may signal market shifts
Detect accumulation or distribution patterns through volume imbalances
View exchanges individually or in aggregate for comprehensive analysis
Calculation Methods The indicator offers three volume delta calculation methods:
VWAP Based (default):
price_range = high - low
buy_percent = (close - low) / price_range
sell_percent = (high - close) / price_range
delta = volume * (buy_percent - sell_percent)
This method distributes volume based on where price closed within the bar's range, providing a nuanced view of buying/selling pressure.
Tick Based :
delta = volume * sign(hlc3 - previous_hlc3)
This approach assigns volume based on the direction of typical price movement between bars, capturing momentum between periods.
Simple :
delta = close > open ? volume : close < open ? -volume : 0
A straightforward method that assigns positive volume to up bars and negative volume to down bars.
When Aggregate Mode is enabled, the indicator sums the volume deltas from all selected exchanges:
aggregate_delta = coinbase_delta + binance_delta + binance_perp_delta
Features
Multi-Exchange Support : Track volume delta across Coinbase, Binance, and Binance Perpetual futures
Advanced Calculation Methods : Choose between VWAP-based, tick-based, or simple volume delta algorithms
Flexible Display Options : Visualize as histogram, columns, area, or line charts
Customizable Colors : Distinct color schemes for each exchange and direction
Smoothing Options : Apply EMA, SMA, or WMA to reduce noise
Aggregate Mode : Combine all exchanges to see total market flow
How to Use
Individual Exchange Analysis : Uncheck "Aggregate Mode" to see each exchange separately, revealing where smart money may be positioning
Divergence Detection : Watch for one exchange showing buying while others show selling
Volume Trend Confirmation : Strong price moves should be accompanied by strong delta in the same direction
Liquidity Analysis : Compare spot vs futures volume delta to identify market sentiment shifts
The Delta Volume BTC - Multi Pair indicator helps identify the "hidden" buying and selling pressure that may not be apparent from price action alone, giving you an edge in understanding market dynamics across the Bitcoin ecosystem.

LineReg Candles with Hma filterOverview
Purpose:
The indicator creates “LinReg Candles” by recalculating OHLC values using linear regression (to smooth out noise) and overlays additional features such as a customizable signal line and an HMA (Hull Moving Average) filter for trend detection. It also plots buy/sell signals and supports alerts.
Customization:
Users can adjust settings for signal smoothing (choosing SMA, EMA, or WMA), HMA periods (preset for Scalping/Intraday or custom values), linear regression length, colors, display options, and alert messages. Inputs are organized into groups for clarity.
Input Definitions
Signal Settings:
signal_length and smoothingType define the period and method used to smooth the close price, creating a signal line.
HMA Filter Settings:
A dropdown (t_type) lets you choose between Scalping, Intraday, or Custom. Based on this, three HMA periods (hma1, hma2, hma3) are set either to fixed values or user-defined custom inputs.
LinReg Settings:
Users can toggle linear regression for OHLC values (lin_reg) and set its period (linreg_length) to reduce price noise.
Color and Display Settings:
These control the colors for buy/sell candles, default bullish/bearish candles, markers, and background highlighting. Display toggles decide whether to show the background, signal line, HMA filter, and the recalculated candles.
Alert and Plot Customization:
Alerts can be enabled with custom messages. Additionally, line width and transparency for the plotted signal and HMA lines are adjustable.
Function Definitions
calcOHLC Function:
Computes OHLC values using linear regression if enabled. Otherwise, it returns the raw price values. This helps in reducing noise.
calcSignalLine Function:
Applies the chosen moving average (SMA, EMA, or WMA) to smooth the recalculated close values and generate a signal line.
getBaseCandleColor Function:
Determines the candle’s base color. It assigns buy/sell colors if specific crossover conditions are met; if not, it defaults to bullish (green) or bearish (red) based on the open/close relationship.
HMA Filter Calculations
HMA Computation:
The script calculates three HMAs (ma1, ma2, ma3) for different periods.
Trend Determination:
It sets a bullish condition (bcn) when ma3 is lower than both ma1 and ma2 with ma1 above ma2. Conversely, a bearish condition (scn) is set when ma3 is higher and the order of the HMAs indicates a downtrend.
Color Coding:
The HMA filter line color changes dynamically (green for bullish, red for bearish) based on these conditions.
Main Calculations
LinReg Candles:
Using the calcOHLC function, the script calculates the new open, high, low, and close values that reduce price noise.
Signal Line:
The signal line is computed on the basis of the smoothed close values using the selected moving average.
Buy/Sell Conditions:
Initial conditions are determined by checking if the recalculated close price crosses over (buy) or under (sell) the signal line.
The base candle color is then adjusted: if the HMA filter confirms the trend (bullish for buy or bearish for sell), the respective buy/sell colors are enforced.
A change in candle color compared to the previous bar triggers a buy or sell signal.
Plotting and Alerts
Visual Elements:
Background: Highlights the chart with a custom color when buy or sell conditions are met.
HMA Filter Line: Plotted (if enabled) with the dynamic color determined earlier.
Candles: The recalculated LinReg candles are drawn with colors based on the combined conditions.
Signal Line: Plotted over the candles with adjustable transparency and width.
Markers: Buy and sell markers are added to visually indicate signal points on the chart.
Alerts:
Alert conditions are set to trigger with predefined messages when a buy or sell signal is generated.
Modularity & Flexibility:
The code is structured with modular functions and clear grouping of inputs, making it highly customizable and user-friendly for open-source TradingView users.
Important how to track the real price on chart:
Locate the Chart Type Menu:
At the top of your TradingView chart, you’ll see a button showing the current chart type (likely a candlestick icon).
Select “Line” from the Dropdown:
Click that button and choose “Line” in the dropdown menu. This changes the main chart to a line chart of the real price.
Screenshots:

Cumulative Price Change AlertCumulative Price Change Alert
Version: 1.0
Author: QCodeTrader 🚀
Overview 🔍
The Cumulative Price Change Alert indicator analyzes the percentage change between the current and previous open prices and sums these changes over a user-defined number of bars. It then generates visual buy and sell signals using arrows and labels on the chart, helping traders spot cumulative price momentum and potential trading opportunities.
Key Features ⚙️
Customizable Timeframe 🕒:
Use a custom timeframe or default to the chart's timeframe for price data.
User-Defined Summation 🔢:
Specify the number of bars to sum, allowing you to analyze cumulative price changes.
Custom Buy & Sell Conditions 🔔:
Set individual percentage change thresholds and cumulative sum thresholds to tailor signals for
your strategy.
Visual Alerts 🚀:
Displays green upward arrows for buy signals and red downward arrows for sell signals directly
on the chart.
Informative Labels 📝:
Provides labels with formatted percentage change and cumulative sum details for the analyzed
bars.
Versatile Application 📊:
Suitable for stocks, forex, crypto, commodities, and more.
How It Works ⚡
Price Change Calculation ➗:
The indicator calculates the percentage change between the current bar's open price and the
previous bar's open price.
Cumulative Sum ➕:
It then sums these percentage changes over the last N bars (as specified by the user).
Signal Generation 🚦:
Buy Signal 🟢: When both the individual percentage change and the cumulative sum exceed
their respective buy thresholds, a green arrow and label are displayed.
Sell Signal 🔴: Conversely, if the individual change and cumulative sum fall below the sell
thresholds, a red arrow and label are shown.
How to Use 💡
Add the Indicator ➕:
Apply the indicator to your chart.
Customize Settings ⚙️:
Set a custom timeframe if desired.
Define the number of bars to sum.
Adjust the buy/sell percentage change and cumulative sum thresholds to match your trading
strategy.
Interpret Visual Cues 👀:
Monitor the chart for green or red arrows and corresponding labels that signal potential buy or
sell opportunities based on cumulative price movements.
Settings Explained 🛠️
Custom Timeframe:
Select an alternative timeframe for analysis, or leave empty to use the current chart's timeframe.
Number of Last Bars to Sum:
Determines how many bars are used to compute the cumulative percentage change.
Buy Condition - Min % Change:
The minimum individual percentage change required to consider a buy signal.
Buy Condition - Min Sum of Bars:
The minimum cumulative percentage change over the defined bars needed for a buy signal.
Sell Condition - Max % Change:
The maximum individual percentage change threshold for a sell signal.
Sell Condition - Max Sum of Bars:
The maximum cumulative percentage change over the defined bars for triggering a sell signal.
Best Use Cases 🎯
Momentum Identification 📈:
Quickly spot strong cumulative price movements and momentum shifts.
Entry/Exit Signals 🚪:
Use the visual signals to determine potential entry and exit points in your trading.
Versatile Strategy Application 🔄:
Effective for scalping, swing trading, and longer-term analysis across various markets.
UPD: uncheck labels for better performance

Orderblocks | iSolani
Revealing Institutional Footprints: The iSolani Volume-Powered Order Block System
Where Smart Money Leaves Its Mark – Automated Zone Detection for Discretionary Traders
Core Methodology
Pressure-Weighted Volume Analysis
Calculates directional commitment using candle position:
Buying Pressure = Total Volume × (Closing Price – Low) / (High – Low)
Selling Pressure = Total Volume × (High – Closing Price) / (High – Low)
Normalizes values against 31-period EMAs to filter retail noise
Adaptive Block Triggering
Identifies significant zones when:
Absolute Buy/Sell Difference > 4× SMA of Historical Differences (default)
Price closes bullishly (green block) or bearishly (red block)
Self-Maintaining Visualization
Blocks auto-extend rightward until price breaches critical level
Invalidated zones removed in real-time via array management
Technical Innovation
Dynamic Threshold Adjustment
Multiplier parameter (default 4) automatically scales with market volatility
Institutional-Grade Metrics
Blocks display:
Volume disparity in absolute terms
Percentage deviation from 33-period average
Directional bias through color-coding
Efficient Memory Handling
O(n) complexity cleanup routine prevents chart lag
System Workflow
Calculates real-time buy/sell pressure ratios
Compares to historical average (31-period default)
Generates semi-transparent zones (85% opacity) at spike locations
Monitors price interaction with block boundaries
Automatically retracts invalid zones
Standard Configuration
Sensitivity : 4× multiplier (ideal for 15m-4h charts)
Visuals : Red/green blocks with white text labels
Duration : 50-bar default extension
Volume Baseline : 33-period EMA filter
Boundary Check : Close beyond block high/low triggers deletion
This system transforms raw market data into a institutional roadmap – not by predicting turns, but by revealing where concentrated volume makes turns statistically probable. The color-coded blocks serve as persistent yet adaptive markers of where professional liquidity resides.